Predictions #2
July 9, 2023 at 12:25 PM
Laying out my reasoning for my second batch of predictions for the Metaculus Quarterly Cup.
Will the winner of stage 9 of the 2023 Tour De France also hold the yellow jersey at the end of the stage?
Resolution Criteria: The question will resolve Yes if the cyclist who wins stage 9 of the 2023 Tour de France is also ranked first in the General Individual Rankings after stage
Prediction: 46% Yes
Reasoning:
There are 21 stages in the Tour de France, raced on consecutive days with a few rest days scattered throughout. The ‘General Individual Ranking’ is the ranking of the riders based on cumulative time across all completed stages. So the question is asking if the winner of stage 9 will also have the lowest cumulative race time at the end of the stage.
I made my prediction when the question opened, which was after stage 6, and then updated it once, after betting odds for stage 9 became available. After stage 6, the GIR leaderboard looked like this:
| Rank | Name | Behind By |
|---|---|---|
| 1 | Vingegaard | - |
| 2 | Pogacar | +25s |
| 3 | Hindley | +94s |
| 4 | +Yates | +194s |
… with lots more riders bunched around +3 to +4 minutes.
I don’t follow cycling at all, but these are some general observations I made after some brief research:
- On flat stages, there’s typically a large group (as many as 50-100 riders) that finishes at the same time, and the top of the overall leaderboard doesn’t change much
- On hilly stages, there’s much more of a spread - the greater the elevation changes, the greater the spread
- Stages 7 and 8 are very flat. Stage 9 is hilly, with a long, steep climb at the end. This was very helpful because I was able to assume the GIR standings would be unchanged after stages 7 and 8 (which ended up being correct)
- Race favorites tend to win at a higher rate on hilly days - last year, Vingegaard and Pogacar (who finished 1st and 2nd), won 3 out of 5 of the hilly days
I also looked at the time spreads on the two hilly days completed so far in this race, 5 and 6, to get a sense for how much time the stage winner might gain on the field:
| Day | 1-2 | 1-5 | 1-10 | 1-20 |
|---|---|---|---|---|
| 5 | +32 | +34 | +98 | +117 |
| 6 | +24 | +120 | +180 | +240 |
To estimate the probability of a Yes resolution, I broke it down as the sum of
- P(V win)
- P(P win, beats V by 25s)
- P(H win, beats V by 94s, beats P by 69s)
- P(other win, beats everyone ahead by enough seconds)
[V = Vingegaard, P = Pocagar, H = Hindley]
Initially, I just guessed at win probabilities for each rider and then went back and adjusted them a bit based on betting odds once those were available.
- P(V win) = 20%, adjusted to 30% w. betting odds
- P(P win) = 20%, no adjustment
- P(H win) = 5%, adjusted to 4% w. betting odds
I found that the chance of anyone other than P, V, or H winning and beating everyone ahead by enough to take the overall lead, was very low. I put this total at 1%.
So the remaining things to estimate:
- P(P beats V by 25s, given that P wins) - estimated 70% chance
- P(H beats V by 94s and P by 69s, given that H wins) - estimated 15% chance
Putting it all together…
P(Yes) = 20% + (20% * 70%) + (5% * 15%) + 1% = 36%
which I adjusted to 46% after increasing P(V win) based on the stage 9 betting odds
Will Ukraine regain control of central Bakhmut by the end of September 2023
Resolution Criteria: The question will resolve Yes if, when checked by Metaculus admins at 5pm ET on September 30, 2023, the ISW interactive map shows the Bakhmut State District Administrative Building—located at Oleksandra Sybirtseva St, 33, Bakhmut, Donetsk Oblast, Ukraine, 84500—is under [Ukrainian control]
Prediction: 22% Yes
Reasoning:
I broke the overall probability into the following:
- P(BT): probability of any Ukrainian ‘breakthrough’ by Sept. 30 (breakthrough meaning a rapid and large territorial gain over a period of about a week
- P(BK | BT): probability of a breakthrough in Bakhmut, given that there’s some Ukrainian breakthrough
- P(Y | BK): probability that the breakthrough reaches the admin building in question, given there’s a breakthrough in Bakhmut
- P(Y | ~BT): probability that Ukraine recaptures the admin building, without a decisive breakthrough, but rather through steady territorial gains that eventually reach the building
P(Y) = ( P(BT) * P(BK | BT) * P(Y | BK) ) + P(Y | ~BT)
P(BT)
So far, the war has lasted 16 months. There have been three major Ukranian counteroffensive ‘breakthroughs’ to date: Kyiv region early in the war, followed by Kharkiv region and Kherson region breakthroughs last year.
This comes out to 0.1875 breakthroughs / month, or 0.8125 chance of no breakthrough per month. This comes out to 47% chance of a breakthrough over 3 months.
Ukraine is currently actively engaged in a counteroffensive, which raises the chances of a breakthrough above baseline. On the other hand, with each prior breakthrough, Russia’s forces become more concentrated, and further gains become more difficult. The counteroffensive has been slow so far, mainly focusing on attrition / supply disruption. Some experts have said this is not a surprise though - even in the Kharkiv an Kherson counteroffensives, there was a long, slow period prior to the decisive breakthroughs.
Considering these factors, I will raise the chance above 47%, to 59%
est. 59%
P(BK | BT)
There seem to be about 5 broad areas, including Bakhmut, where we may see a breakthrough.
There’s been recent progress in Bakhmut, however, there are also reason to think a breakthrough there may be more difficult. The city is symbolically important for Russia to hold, as it’s their sole big achievement in recent months. Of course, for that same reason, Ukraine has extra incentive to recapture it. It’s also a city with densely packed buildings, which makes rapid advance more difficult.
est. 30%
P(Y | BT)
There’s not a huge amount of ground Ukraine needs to cover to retake the admin building. The city is relatively small and less than half of it would need to be recaptured to reach the building. Assuming a breakthrough in the region, it seems very likely this building would be recaptured.
est. 85%
P(Y | ~BT)
Again, there isn’t a huge amount of land area to reach the building. Geographically, it’s west of the river that bisects the town and slightly outside the densest part of town. It’s certainly possible it could be reached through steady gains. Given the urban setting, gains may be slow. Ukraine may also attempt to make gains around the outside to eventually attempt encirclement.
est. 7%
So in total…
P(Y) = (0.59 * 0.30 * 0.85) + 0.07 = 0.22
22% Yes
What will be the Accumulated Cyclone Energy of the 2023 Atlantic hurricane season on September 30, 2023?
Resolution Criteria: The question resolves as the observed "North Atlantic Accumulated Cyclone Energy" reported by Colorado State University's real-time tracker for the 2023 hurricane season through the date of September 30, 2023.
Prediction:
Lower quartile: 109
Median: 128
Upper quartile: 143
Reasoning:
Background: ACE is essentially a measure of how intense a given storm season is. It’s calculated by summing the individual ‘cyclone energy’ of each storm throughout the season. The storm energy is calculated by squaring the maximum sustained wind velocity within the storm and adding this to a sum every few hours.
The resolution date, September 30, is about 2/3 of the way through the season.
To come up with estimates, I’m doing the following:
- Starting with the historical averages (‘climatology’) that show how ACE builds over the course of the year. [see image below]
- Scaling the values so that the plot has the same shape, but finishes at 160 - the forecasted ACE from Colorado State’s July 6th forecast
- Taking the value predicted by that plot at September 30
- Adding the current deviation between the scaled, forecasted value for today, and the measured value
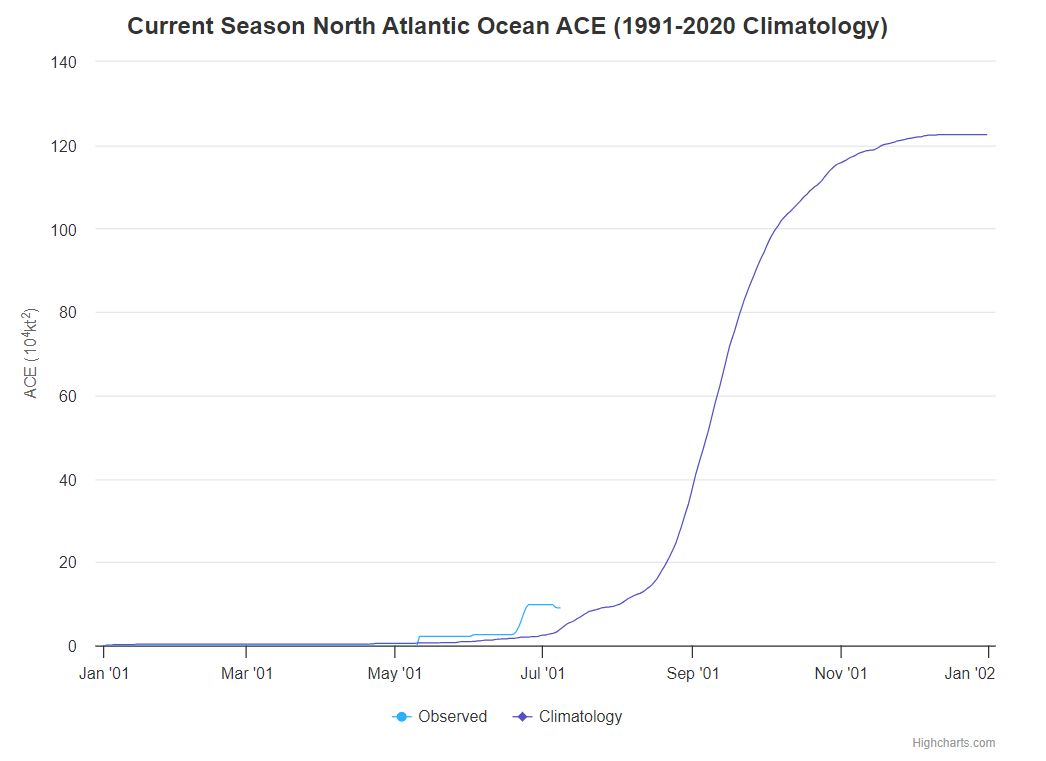
So for example, on July 6:
- the historical average for September 30 is an ACE of 94.1
- scaled to an expected full season ACE of 160, that becomes 122.91
- The historical and scaled estimates for July 6th are 3.1 and 4.05 respectively
- The actual ACE on July 6th was 9.2, a deviation of +5.15 from the forecast
- So my estimate for September 30 is 122.91 + 5.15 = 128
The plot below shows the climatology, scaled, and ‘adjusted scaled’ value forecasts for each day in the season - the vertical dashed line indicates Sept. 30

Colorado State also publishes the uncertainty for their estimates, so I used the same approach to compute the 25 and 75 percentiles, but then apply an additional scaling to those bounds that will reduce them to near 0 by the time we reach September 30.
I plan to just update this every couple days with the latest measured data, and adjust the scaling if Colorado State publishes updated forecasts.